Which report do I need? (all reports explained)
Open the Reports module from the top menu and pick a report category in the left panel, then choose the report from the drop-down. Most reports work the same way: pick your filters and a date range, click Get Report, and use the Actions button to export.
Find the right report
| I want to see… | Go to |
|---|---|
| A quick summary of revenue, invoices, jobs, vehicles and employees | Reports dashboard |
| Deleted jobs, invoices, estimates, purchase orders, customers or timesheets | Audit |
| Customers by tag, equipment per customer, expiring contracts | Customer |
| Equipment warranties, service history, equipment by location | Equipment |
| Estimates by status, customer, tag or office user | Estimations |
| Paid bills, unpaid bills, bills by age | Expenses |
| Unpaid customer invoices by age, memberships | Financials |
| Stock levels, items used, purchase orders, part and tool history | Inventory |
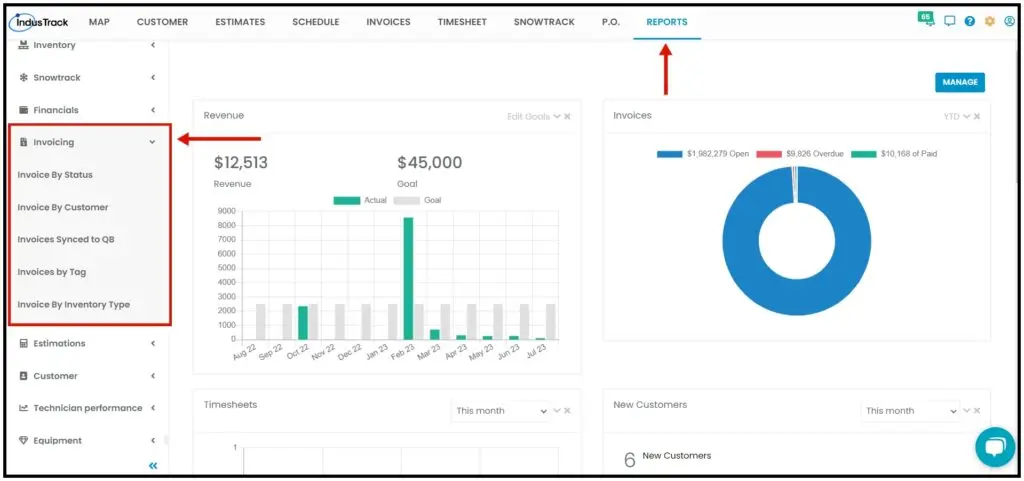
| Invoices by status, customer, tag, inventory type, or QuickBooks sync | Invoicing |
| Jobs by tech, customer or status, items used, forms, reminders | Scheduling. See Which job reports can I run? |
| Technician hours, budget vs actual, profit and revenue per tech | Technician Performance |
| Clock in/out, hours, pay, overtime, QuickBooks timesheet sync | Timesheet |
| When office users logged in | Users |
| Vehicle locations, trips, fuel, idle time, maintenance, safety | Vehicle Tracking. See Which vehicle tracking reports can I run? |
How every report works
-
Open the Reports module from the top menu and click the category in the left panel.
-
Choose the report from the drop-down.
-
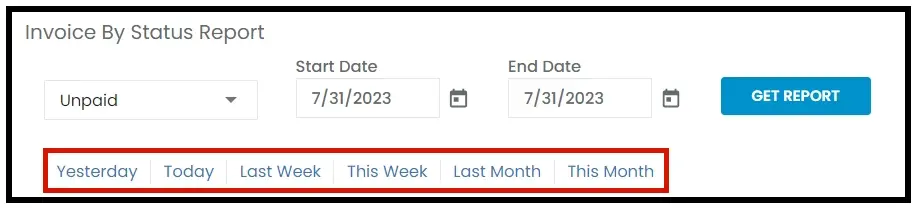
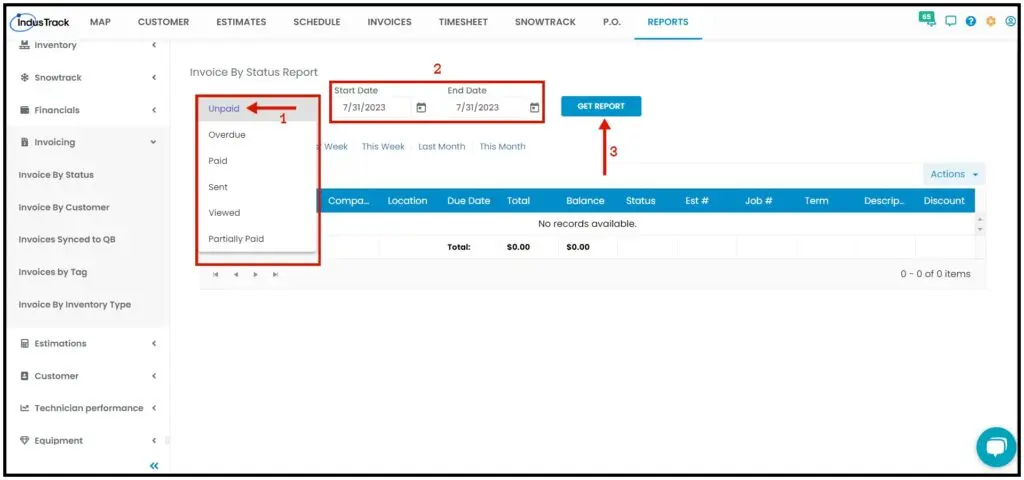
Set the filters the report asks for (for example employees, customers, tags or status) and a start and end date. Many reports also offer preset periods: Yesterday, Today, Last Week, This Week, Last Month and This Month.
-
Click Get Report.
-
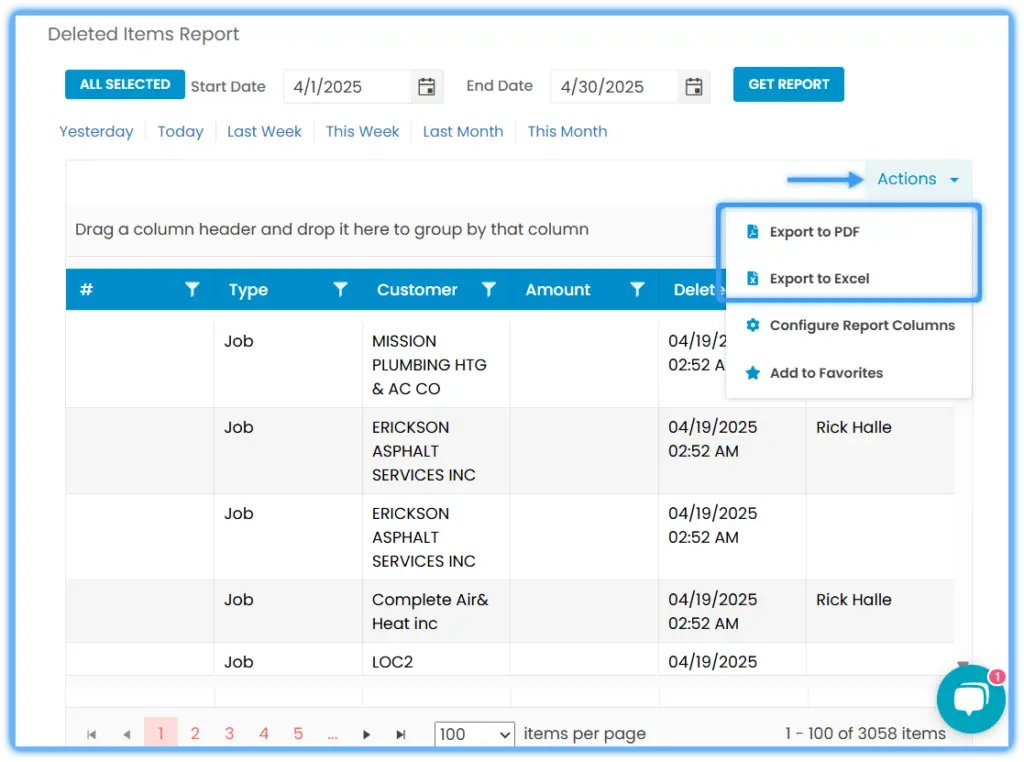
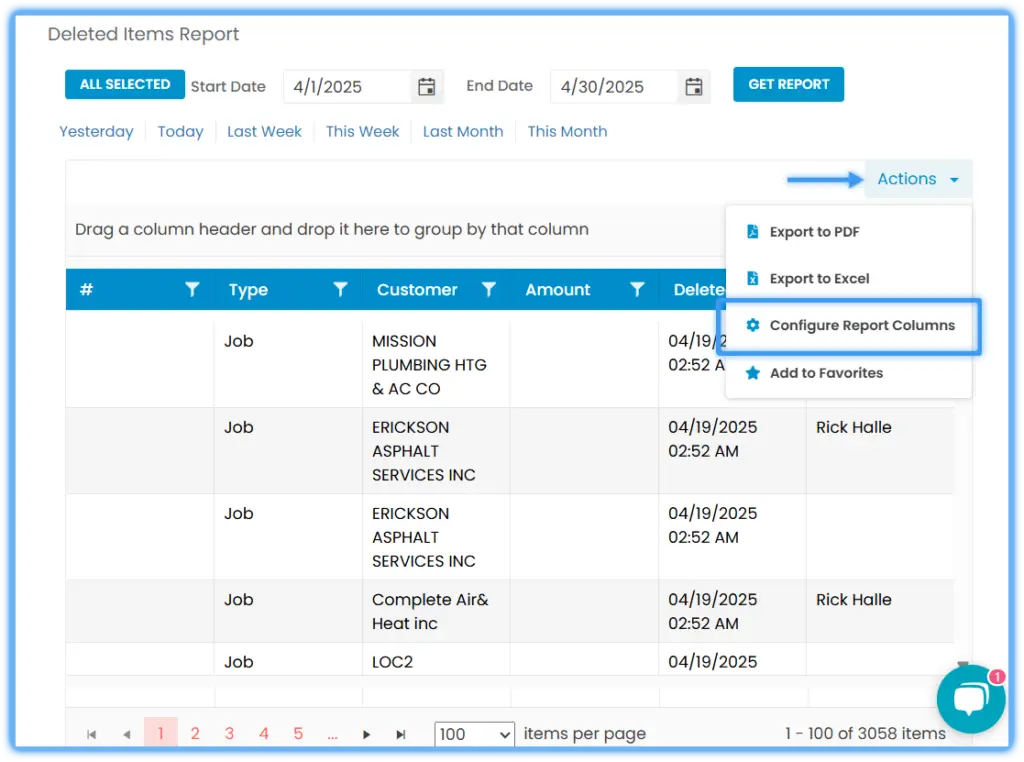
Click Actions for more options. Which options appear depends on the report:
- Export to PDF or Export to Excel: download the report.
- Configure Report Columns: uncheck the columns you don't want and click SAVE. Unchecked columns are left out when you generate the report. At least one column must stay checked.
- Schedule Report: send the report by email on a schedule. See How do I schedule a report to email automatically?
- Add to Favorites: once you add a report, a Favorites tab appears at the top right of the left panel, listing all your favorite reports.
Watch: Save is disabled when no columns are checked Watch: Setting up Schedule Report from the Actions menu 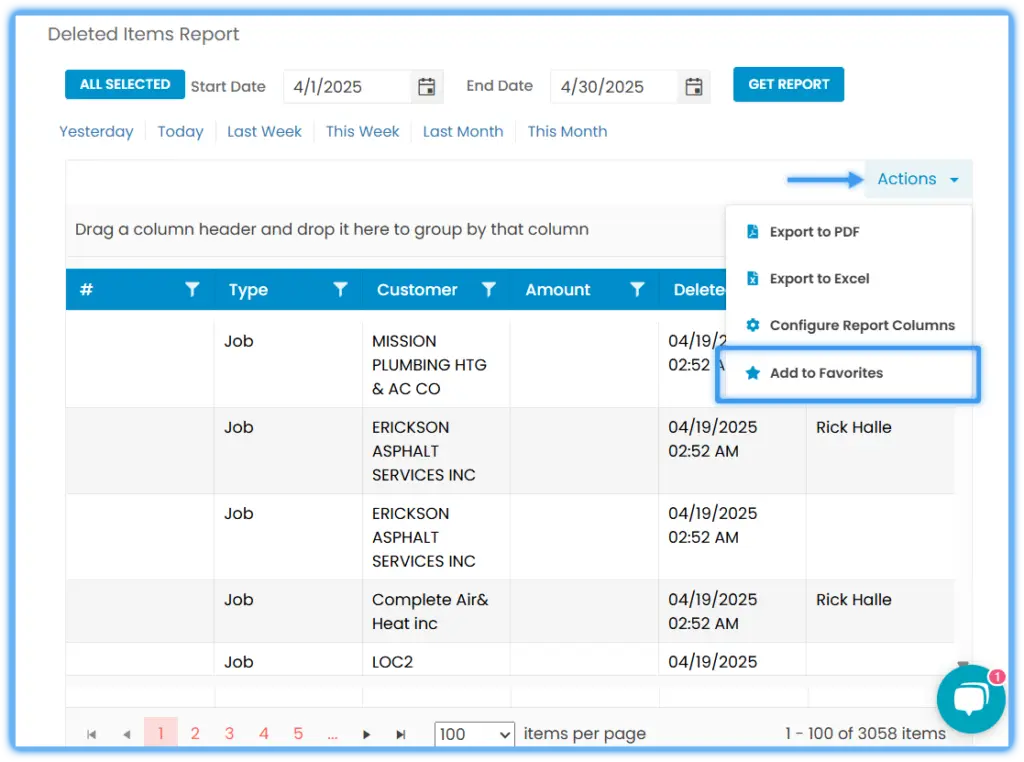
Reports dashboard
The dashboard is the default page of the Reports module. It shows a summary of key reports as graphs and figures. Most widgets have a drop-down to pick the period.
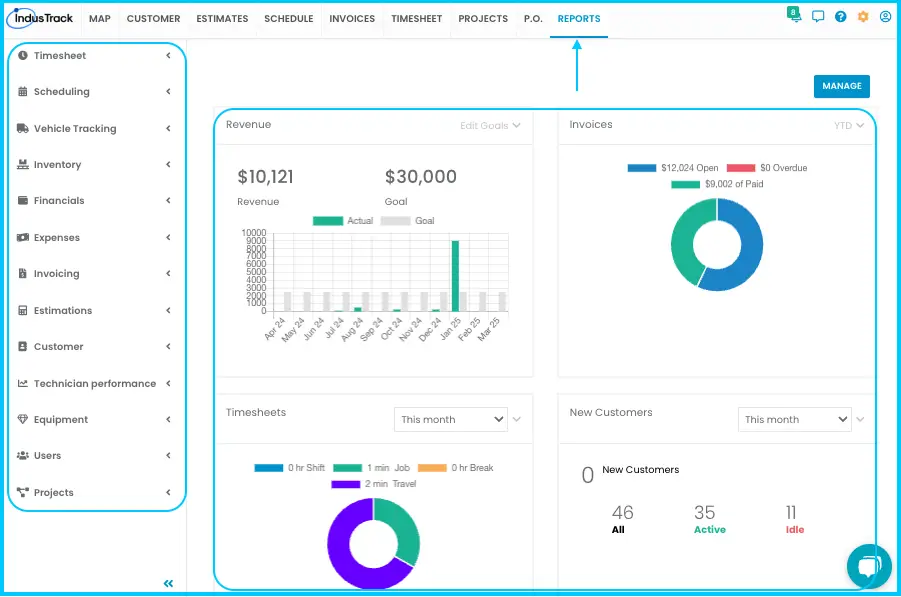
| Widget | What it shows |
|---|---|
| Revenue | Revenue progress against your goals. Click Edit Goals to set monthly or annual revenue goals and the start of your financial year, then click Save. |
| Invoices | Open (unpaid), overdue (unpaid and past the due date) and paid invoices. |
| Timesheets | Hours spent on shifts, jobs, breaks and travel. Periods: this month, quarter, year or financial year, or last month, quarter or year. |
| New Customers | Total, active and inactive customers. |
| Job Dashboard | Job statuses over the chosen period. |
| Job By Value Dashboard | Completed, approved and invoiced jobs with their total values. |
| Estimates Converted to Jobs | Number and value of estimates won or lost. |
| Top 5 Idle Vehicles | The five vehicles with the most idle time. |
| Top 5 Speeding Vehicles | The five vehicles with the highest recorded speeds. |
| Customer Activity | Time field employees spent at customer locations and driving. |
| Company Activity | Jobs assigned, jobs completed, time worked, time billed, materials used and materials billed. |
| Employee Activity | Number of jobs assigned, jobs completed, time worked and time billed. |
| Estimates Won by Customer | Each customer's name and the total amount won in the period. |
| Revenue by Customer | Each customer's name and the revenue they generated in the period. |
| Employee Profitability | Profit generated by each employee in the period. |
| Estimate By Status | Estimates in draft, invoiced, won, lost, scheduled or assigned, with the employees assigned. |
| Revenue By Status | Revenue by status: Paid, Overdue and Open Invoices. |
To change the dashboard, click Manage, use the up and down arrows to reorder widgets, uncheck any you don't need, and click Save.
Audit
Shows deleted records, who deleted them and when.
Deleted Items: deleted jobs, estimates, invoices, customers and purchase orders. It's also listed in the Scheduling report drop-down.
-
Go to Reports›Audit›Deleted Items.
-
Select the item type and a date range or preset period.
-
Click Get Report.
-
For a job, click View in the View Details column to open a detailed report.
Watch: Running the Deleted Items report and opening a job's details
| Column | Shows |
|---|---|
| # | ID of the job, estimate, invoice, customer or purchase order |
| Type | Job, Estimate, Invoice, Customer or Purchase Order |
| Customer | Customer name |
| Amount | Total value of the deleted item |
| Deleted At | Date of deletion |
| Deleted By | User who deleted it |
| View Details | Opens a detailed report for a job |
The #, Type and View Details columns can't be turned off.
Deleted Timesheets: timesheet entries that were removed, with the employee name, date and time of the entry, hours logged, who deleted it and when. Useful for payroll checks.
-
Go to Reports›Audit›Deleted Timesheets.
-
Choose employees and a date range.
-
Click Get Report.
Watch: Running the Deleted Timesheets report
Customer
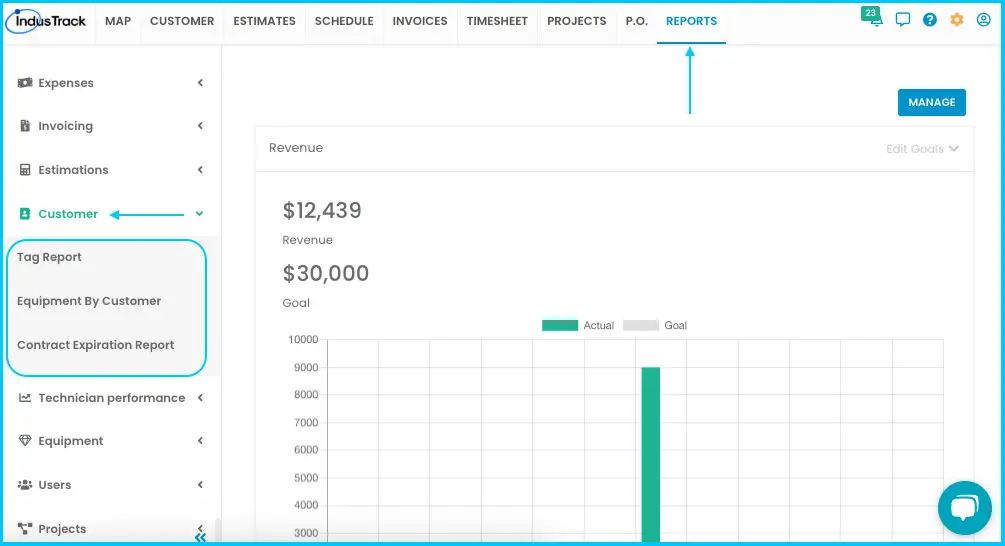
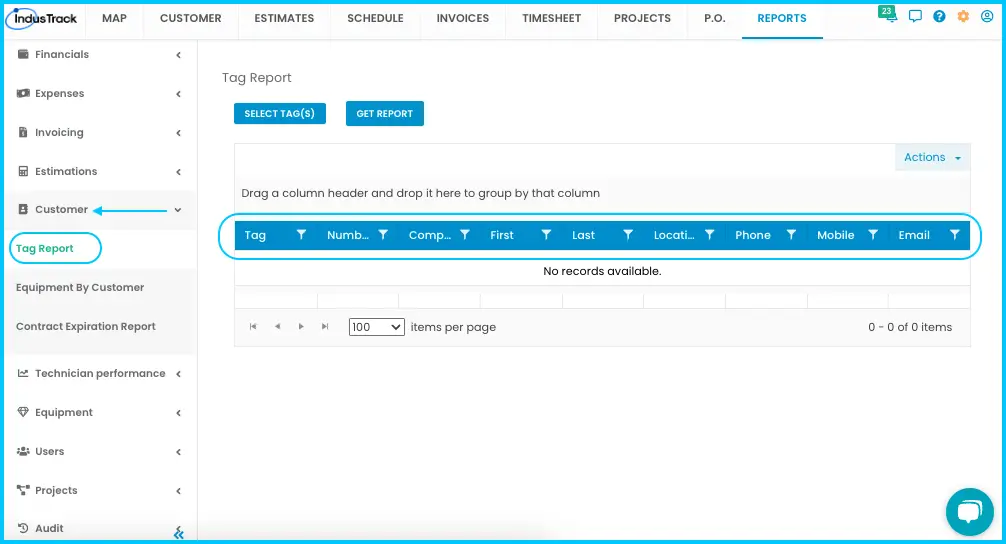
Tag Report: customers with the tags you choose.
- Go to Reports›Customer›Tag Report.
- Click Select Tag/s and choose one or more tags.
- Click Get Report.
Columns: Tag, Number (tag ID), Company, First and Last (contact name), Location (service location), Phone and Mobile, Email.
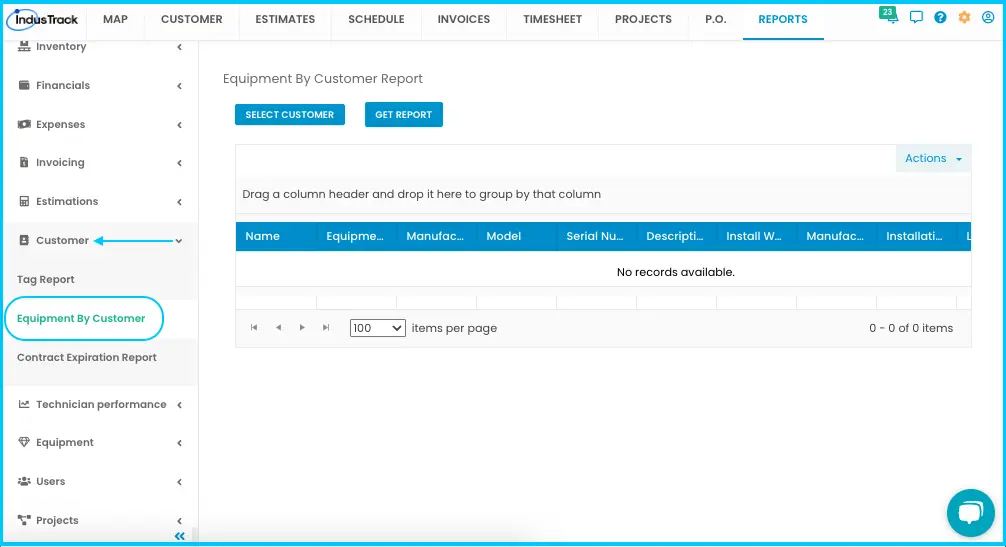
Equipment By Customer: equipment owned by or linked to one customer.
- Go to Reports›Customer›Equipment By Customer.
- Click Select Customer and choose one customer (only one at a time).
- Click Get Report.
Columns: Name (customer), Equipment Location, Manufacturer, Model, Serial Number, Description, Install Warranty, Manufacturer Warranty, Installation Date, Location, Notes.
Contract Expiration Report: customer contracts about to expire, from the Contracts tab of each customer's profile. New and existing contracts are included.
- Go to Reports›Customer›Contract Expiration Report.
- In Select Expiring In, choose one option: All, Expiring in 30 days, Expiring in 60 days or Expiring in 90 days.
- Click Get Report.
Columns: Customer Name, Location (main location), Service Location, Description, Expiration Date. If a service agreement covers several pieces of equipment, each piece appears as its own row.
Equipment
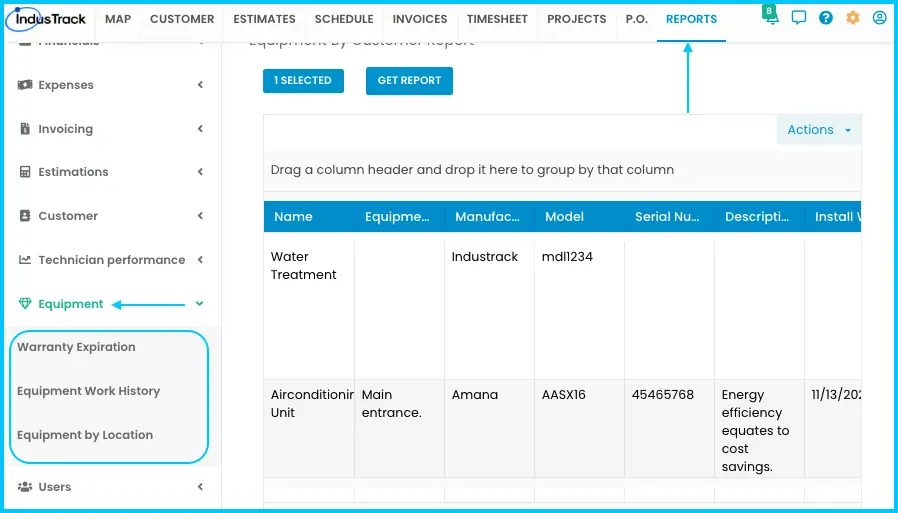
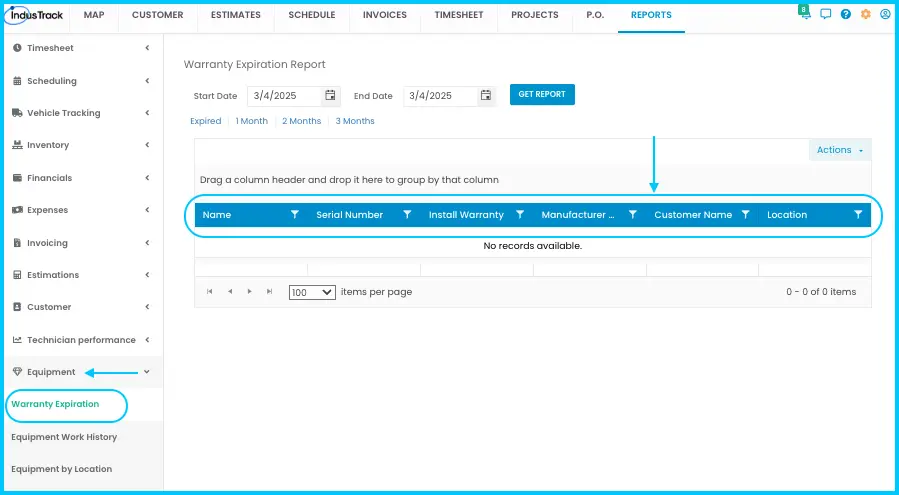
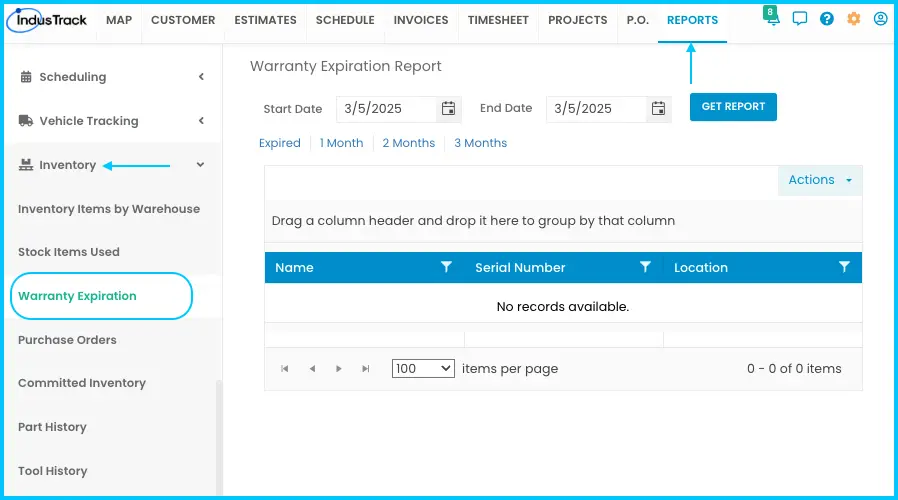
Warranty Expiration: existing customer equipment (from your customer list) with warranties that expire in the chosen range. This is a different report from Warranty Expiration under Reports›Inventory.
-
Go to Reports›Equipment›Warranty Expiration.
-
Select a start and end date, or a preset: Expired, 1 Month, 2 Months or 3 Months.
-
Click Get Report.
Watch: Running the Warranty Expiration report for equipment
Columns: Name, Serial Number, Install Warranty, Manufacturer Warranty, Customer Name, Location.
Equipment Work History: service work done on a customer's equipment.
-
Go to Reports›Equipment›Equipment Work History.
-
Select a customer and click Get Report.
-
Click View in the History column to see the equipment's job and service note history.
- Click the + icon next to a job number to expand the job details.
- Click the job number to preview the job. From there you can download attached images and save the report as a PDF.
Watch: Running Equipment Work History and opening a job's history
Columns: Equipment Name, Manufacturer, Model, Serial Number, Service Location, History.
Equipment by Location: a customer's equipment organized by location. Select a customer and click Get Report. Columns: Equipment Name, Manufacturer, Model, Serial Number, Service Location, Equipment Location.
Estimations
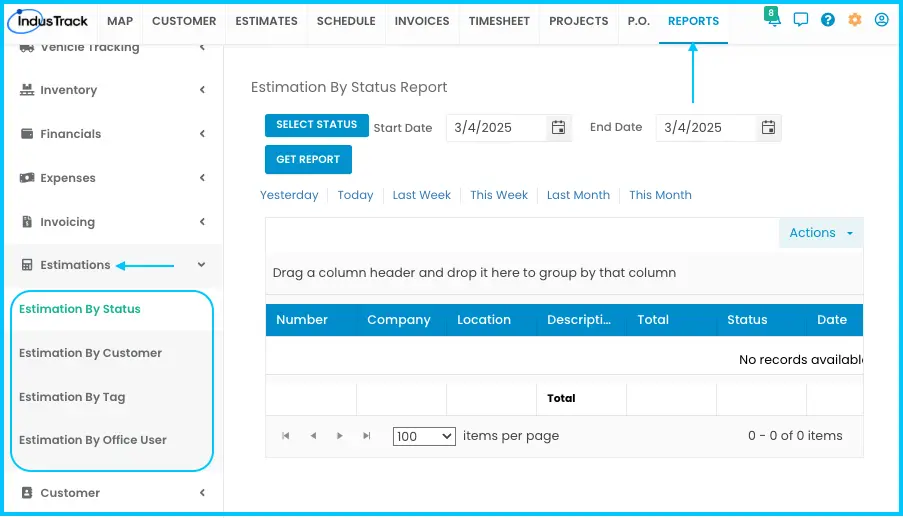
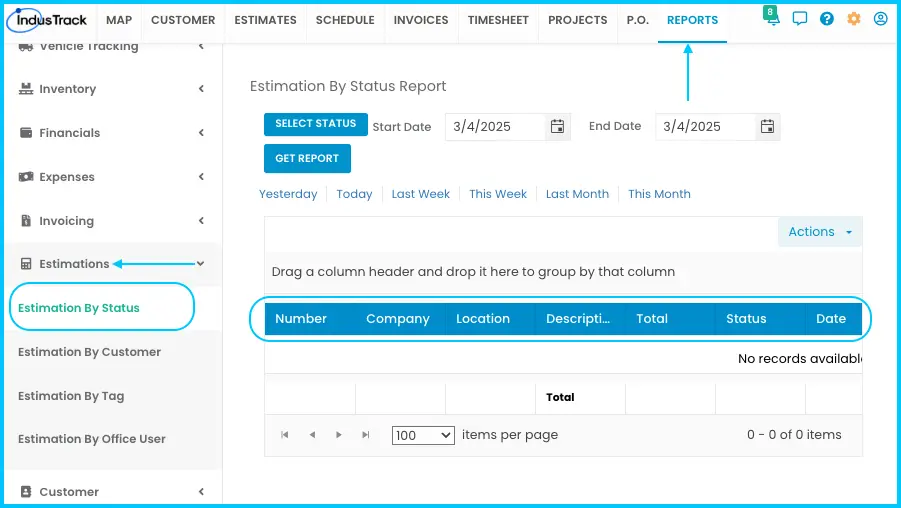
All four reports have the same columns: Number, Company, Location, Description, Total, Status, Date (created), Job #, Invoice #, Cost, Profit Value and Created By.
| Report | Filters |
|---|---|
| Estimation By Status | One status, plus a date range or preset |
| Estimation By Customer | One customer at a time, plus start and end date |
| Estimation By Tag | One or more tags, plus start and end date |
| Estimation By Office User | One, several or all users who created the estimates, plus start and end date |
Estimate statuses:
| Status | Meaning |
|---|---|
| Change Requested | Sent to the customer for approval or changes. |
| Draft | Not finalized yet |
| Won | Approved |
| Scheduled | Approved and converted into a job |
| Sent | Emailed to the customer |
| Lost | Rejected |
| Invoiced | Invoiced |
Expenses
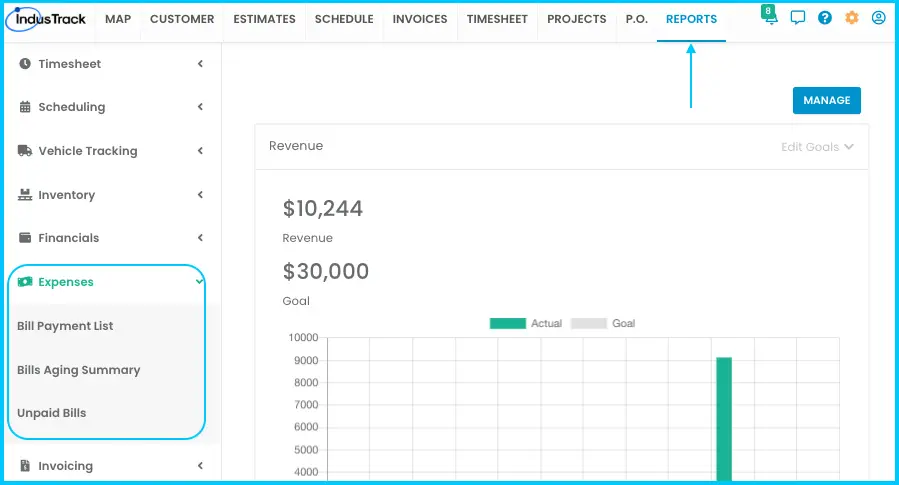
Bill Payment List: bills that have been paid in full or in part. Bills with no recorded payment don't appear. Select a date range or preset and click Get Report. Columns: Payment Method, Vendor, Payment Date, Transaction Number (for example check or receipt number), Amount.
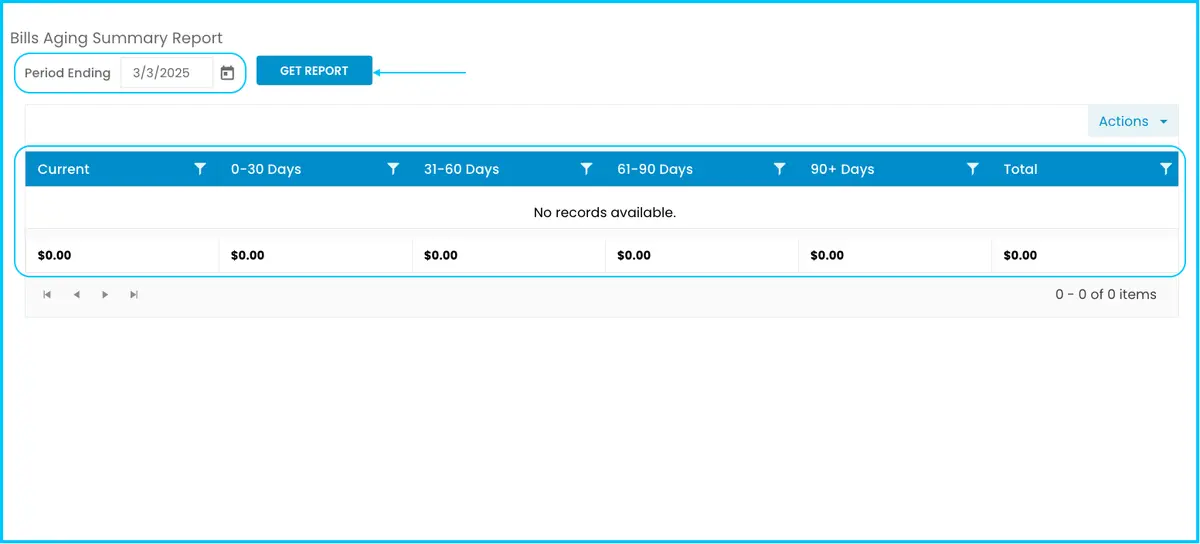
Bills Aging Summary: how much you owe vendors, grouped by how late the bills are. Select a Period Ending Date and click Get Report. Columns: Current (not yet due), 0-30 Days Late, 31-60 Days Late, 61-90 Days Late, 90+ Days Late, Total.
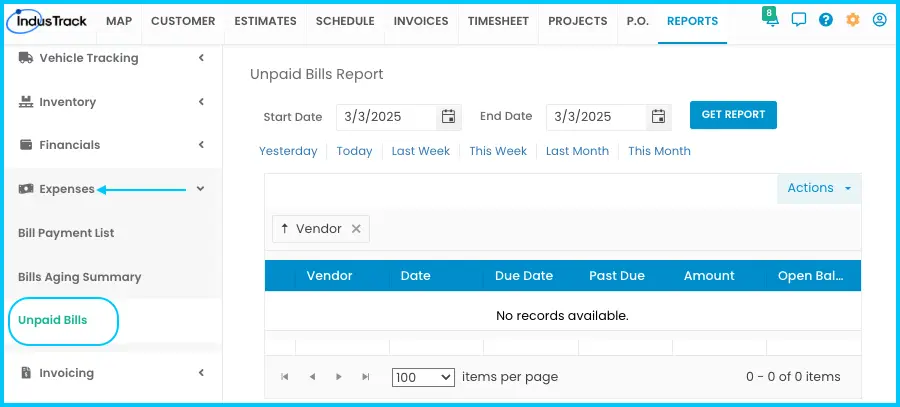
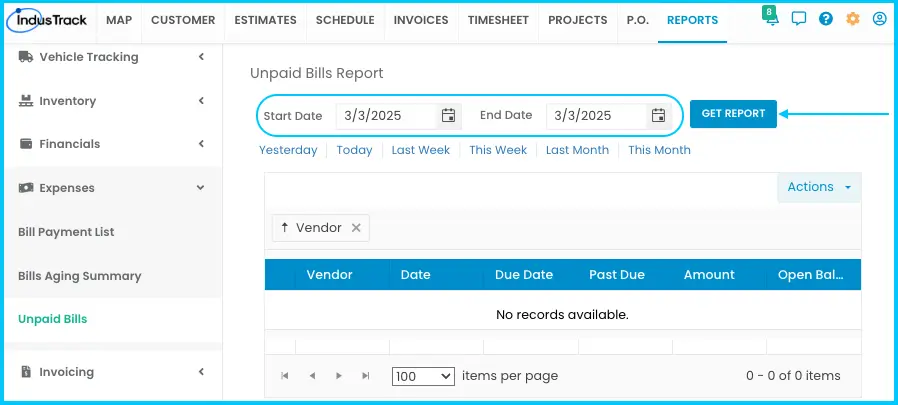
Unpaid Bills: bills still to be paid. Select a Start Date and End Date and click Get Report. Columns: Vendor, Date (bill created), Due Date, Past Due (days past due), Amount, Open Balance.
Financials
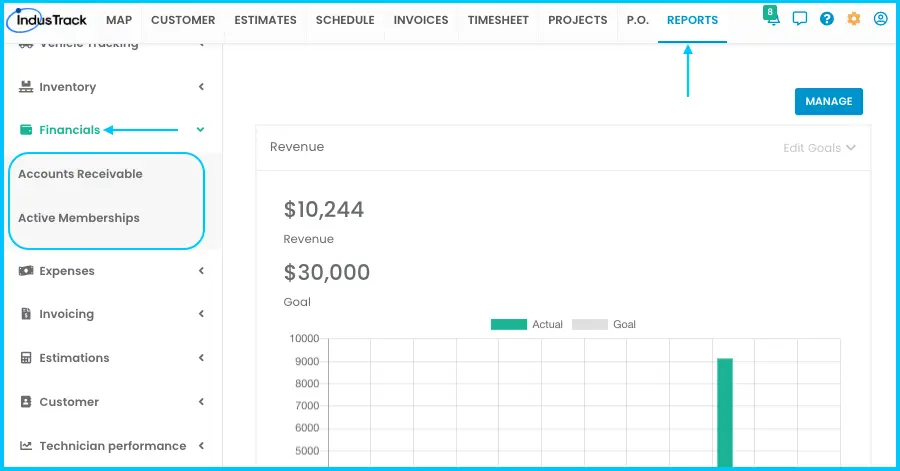
Accounts Receivable: what each customer owes, grouped by age.
-
Go to Reports›Financials›Accounts Receivable.
-
Select the Period Ending date and click Get Report.
Watch: Running the Accounts Receivable report
Columns: Customer, 0-30 Days, 31-60 Days, 61-90 Days, 90+ Days, Total.
Active Memberships: customers with active or expired memberships.
-
Go to Reports›Financials›Active Memberships.
-
Select the Status (Active, Expired or All), a Start Date and End Date, and click Get Report.
Watch: Running the Active Memberships report
Columns: Customer, Type, Description, Start Date, End Date, Remaining Months, Status.
Inventory
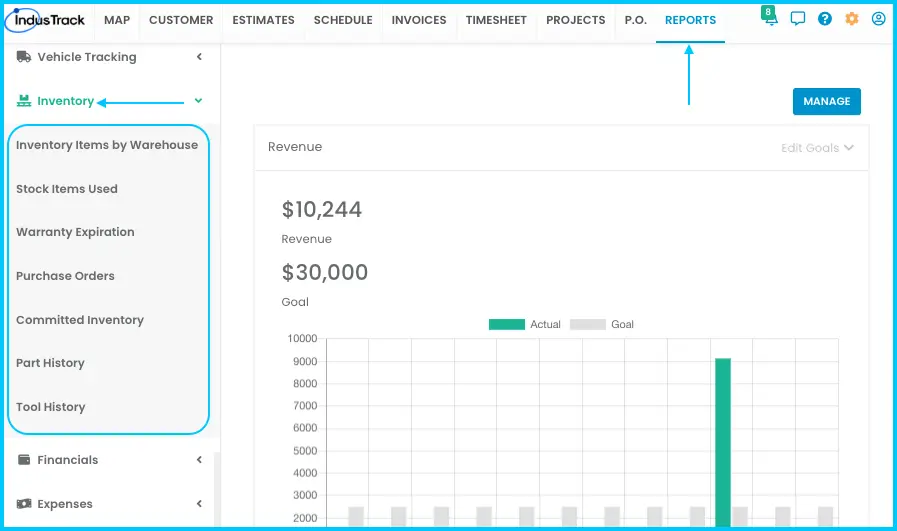
| Report | Filters | Columns |
|---|---|---|
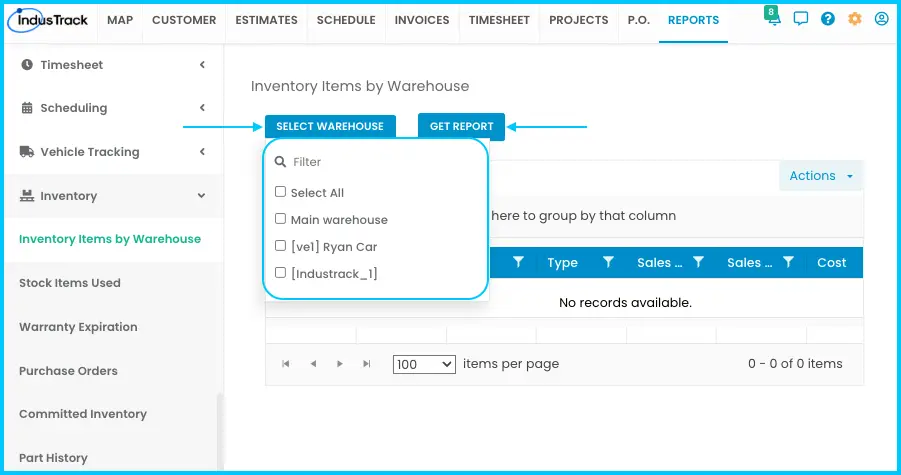
| Inventory Items By Warehouse | One or more warehouses | Warehouse, Name, SKU, Type, Sales Description, Sales Price, Cost, Quantity on Hand |
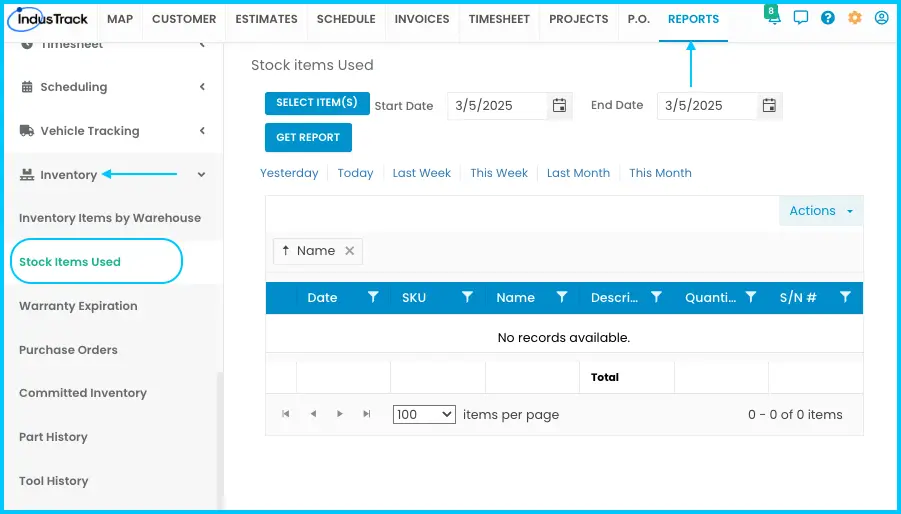
| Stock Items Used (items used in jobs) | Items and date range (daily, weekly or monthly) | Date, SKU, Name, Description, Quantity Used, Serial Number (S/N) |
| Warranty Expiration | Date range | Name, Serial Number, Install Warranty, Manufacturer Warranty, Customer Name, Location |
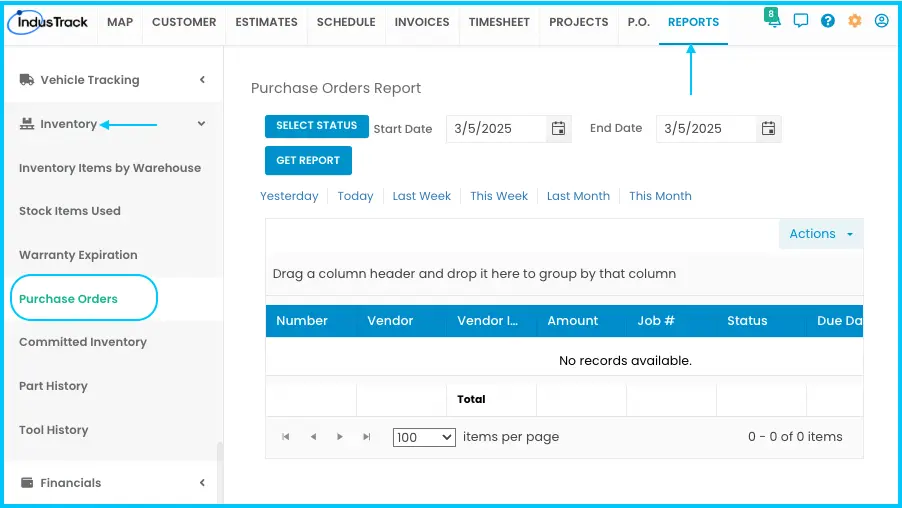
| Purchase Orders | Status (New, Sent, Partially Received or All) and date range | Number, Vendor, Vendor Invoice Number, Amount, Job #, Status, Due Date, Created By |
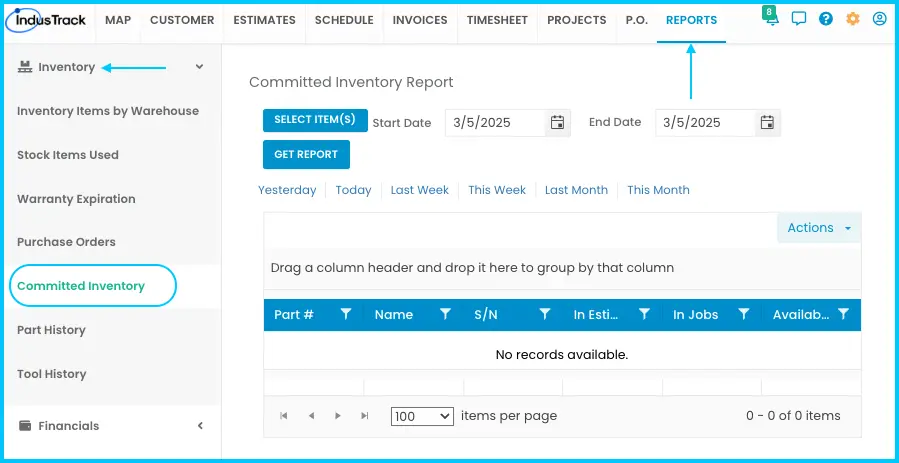
| Committed Inventory | Items (or all) and date range | Part #, Name, Serial Number (S/N), Estimates, In Jobs, Available |
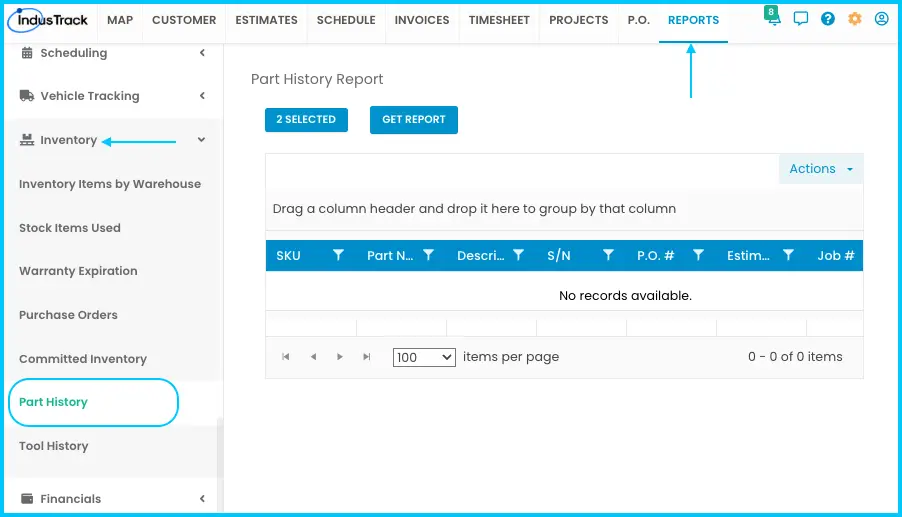
| Part History | Items (or all) | SKU, Part Name, Description, Serial Number (S/N), P.O. #, Estimate #, Job #, Invoice # |
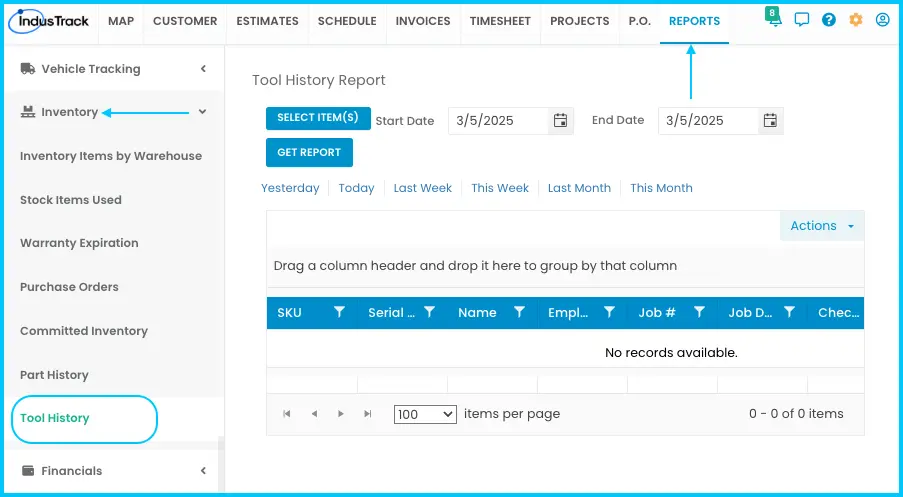
| Tool History | Items (or all) and date range | SKU, Serial Number (S/N), Name, Employee, Job #, Job Description, Check Out, Check In, Signature |
How the data gets there:
-
Committed Inventory counts items on estimates marked Won (not Draft or Lost). When a won estimate is saved, its quantities show under Estimates. When it's converted to a job and saved, they move to In Jobs.
-
Part History shows serial items on jobs. When a job with a serial item is saved, dispatched and completed, the item appears with its Job #. After the job is converted into an invoice, rerun the report to see the Invoice # too.
-
Tool History shows tool check-ins and check-outs from the IndusTrack mobile app. When a field employee checks a tool in or out with a signature and syncs the app, the details appear. Click the signature icon to see the signature.
Warranty Expiration here is a different report from Warranty Expiration under Reports›Equipment, which shows existing customer equipment from your customer list.
Invoicing
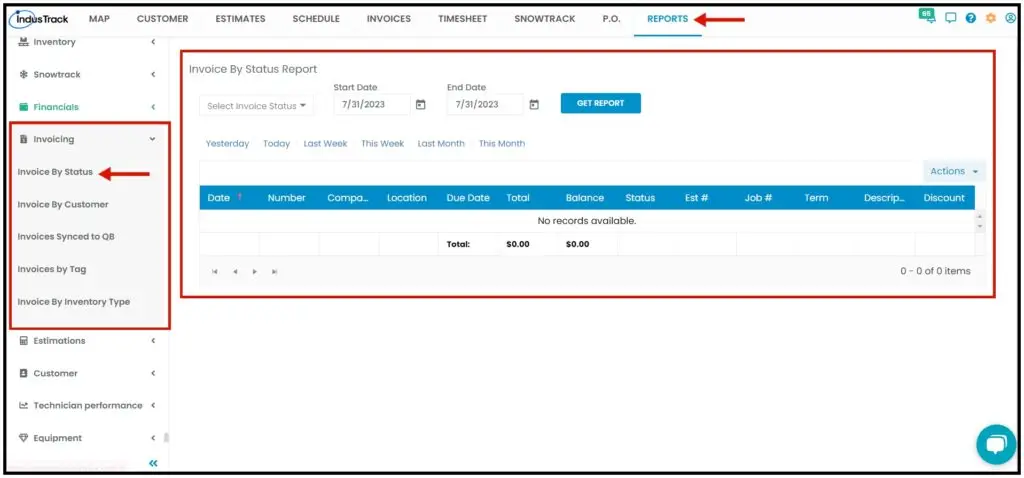
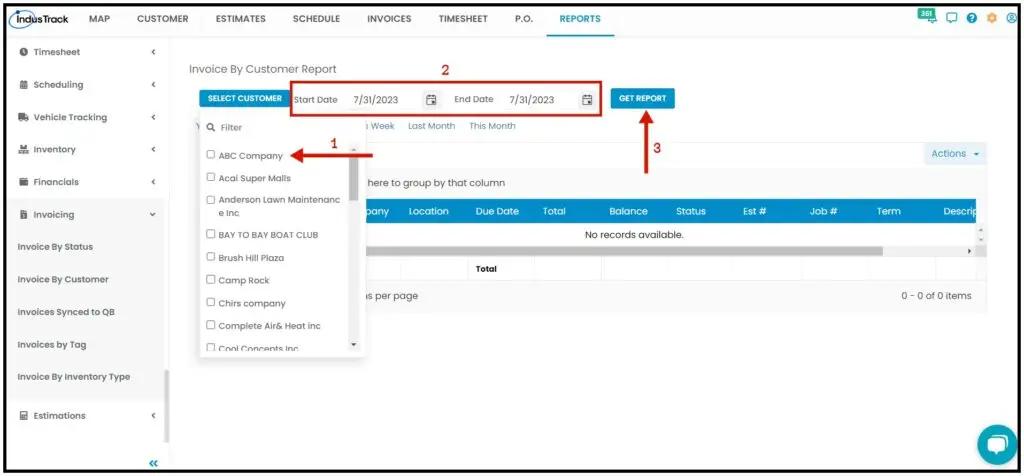
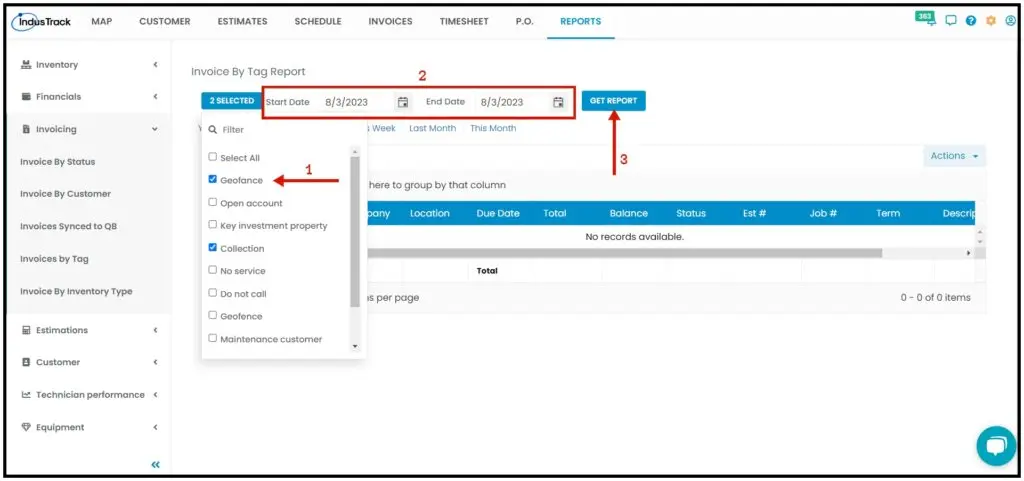
Invoice columns (Invoice By Status, Invoice By Customer and Invoice By Tag):
| Column | Shows |
|---|---|
| Date | Date the invoice was created |
| Number | Invoice number |
| Company | Customer being invoiced |
| Location | Service location |
| Due Date | Payment deadline. It fills in automatically when a term is added to the invoice. |
| Total | Total amount |
| Balance | Amount still unpaid |
| Status | Current invoice status |
| Est # | Linked estimate, if any |
| Job # | Linked job, if any |
| Term | Payment terms |
| Description | Invoice description |
| Discount | Discount on the invoice |
| Report | Filters | Notes |
|---|---|---|
| Invoice By Status | One status at a time (Unpaid, Overdue, Paid, Sent, Viewed, Partially Paid), plus a date range or preset | Standard invoice columns |
| Invoice By Customer | Select Customer (one at a time) and invoice created date | Standard invoice columns |
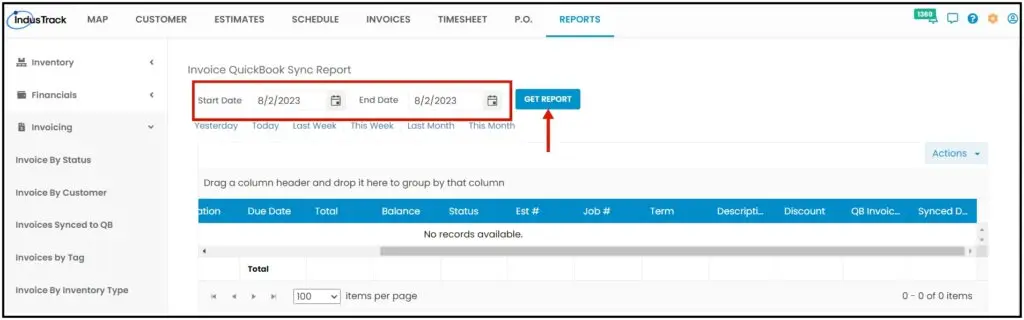
| Invoices Synced to QB | Invoice created date | Standard invoice columns plus QB Invoice # (number in QuickBooks) and Synced Date. |
| Invoice By Tag | Select Tag/s (one or more) and invoice created date | Standard invoice columns |
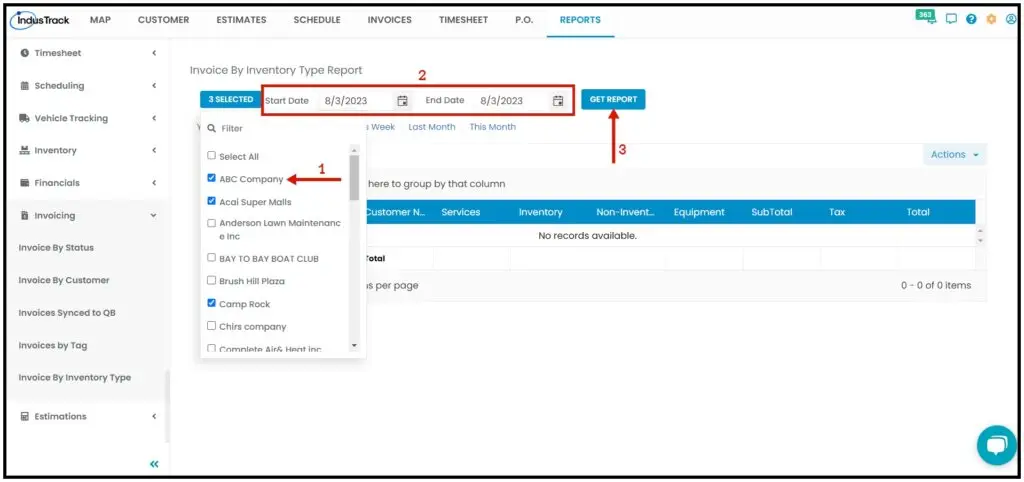
| Invoice By Inventory Type | Select Customer (one, several or all) and job completion date | Columns: Inv. #, Due Date, Customer Name, Services, Inventory, Non-Inventory, Equipment, SubTotal, Tax, Total |
Technician Performance
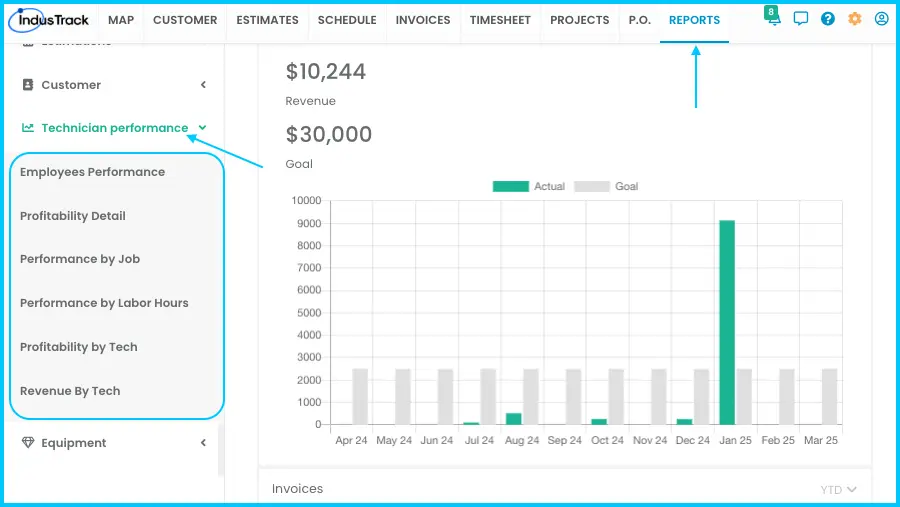
| Report | What it shows | Columns |
|---|---|---|
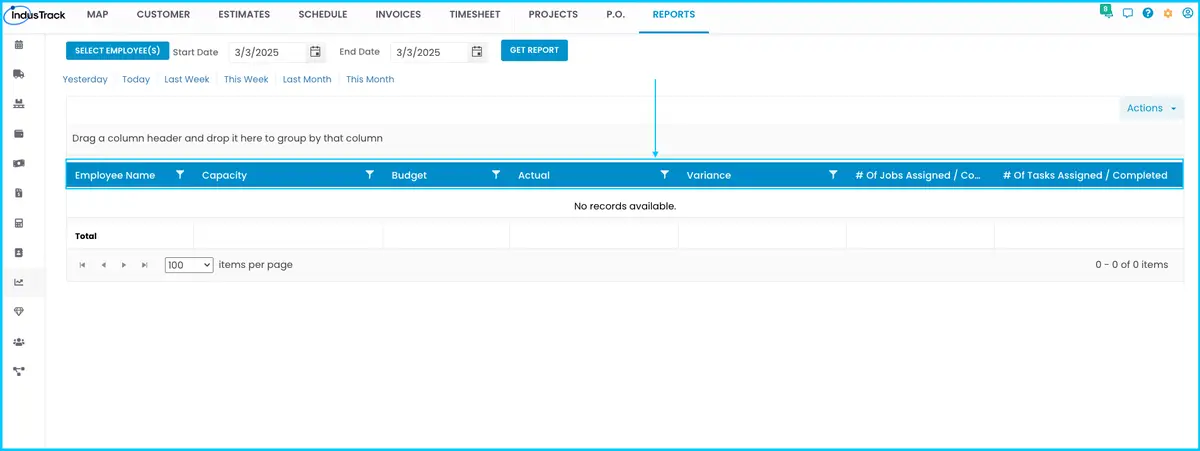
| Employees Performance | Each tech's assigned and completed work | Employee Name, Capacity (maximum workload), Budget (estimated time), Actual (hours worked), Variance, # Of Jobs Assigned / Completed, # Of Tasks Assigned / Completed |
| Profitability Detail | Jobs and profit per tech | Date, Employee Name, Customer, Job #, Start Time, End Time, Job Time, Labor Cost (job time × labor rate), Invoice Total, COGS (cost of inventory used), Total Cost (labor cost + COGS) |
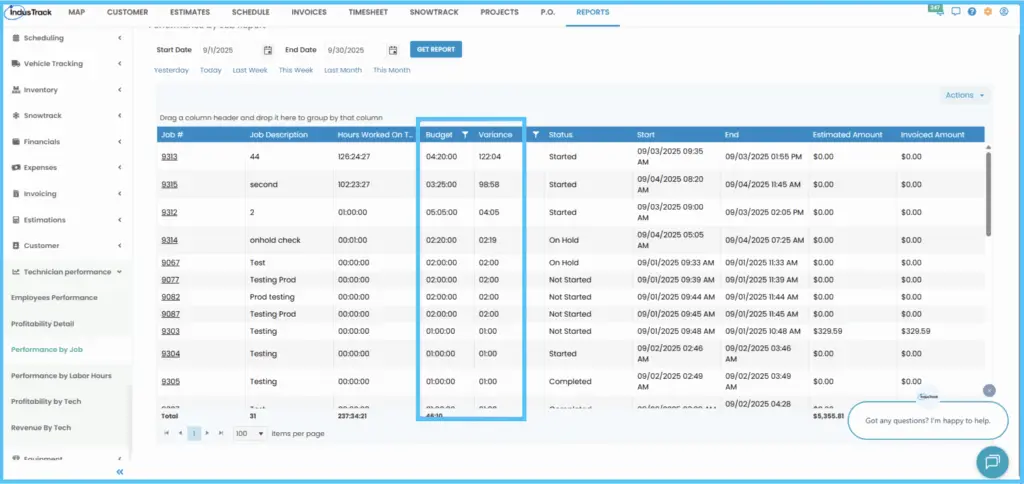
| Performance by Job | Tech work per job | Job #, Description, Hours Worked, Status, Start / End Time, Estimated, Invoiced Amount, Budget, Variance |
| Performance by Labor Hours | Hours worked per tech | Employee Name, Time Worked, Paid Time, Billable Hours, Bill Time, Profit |
| Profitability by Tech | Job profit per tech | Employee Name, Customer, Job #, Job Description, Revenue, Cost, Profitability (revenue minus cost) |
| Revenue by Tech | Revenue per tech | Employee Name, Customer, Job #, Job Description, Revenue |
Gross profit in Profitability Detail = Invoice Total – Total Cost.
To generate: go to Reports›Technician Performance, choose the report, select employees and a date range (Performance by Job uses job start and end date), and click Get Report.
Employee details: in Employees Performance, click an employee's name to see their jobs grouped by customer: Customer Name, Description, Job #, Budget, Actual, Variance, # Tasks and Completion Date. Click Export to PDF to save it.
In Performance by Labor Hours:
- Paid Time: billable working hours.
- Billable Hours: the hours charged to clients.
- Bill Time: the amount billed to clients.
Timesheet
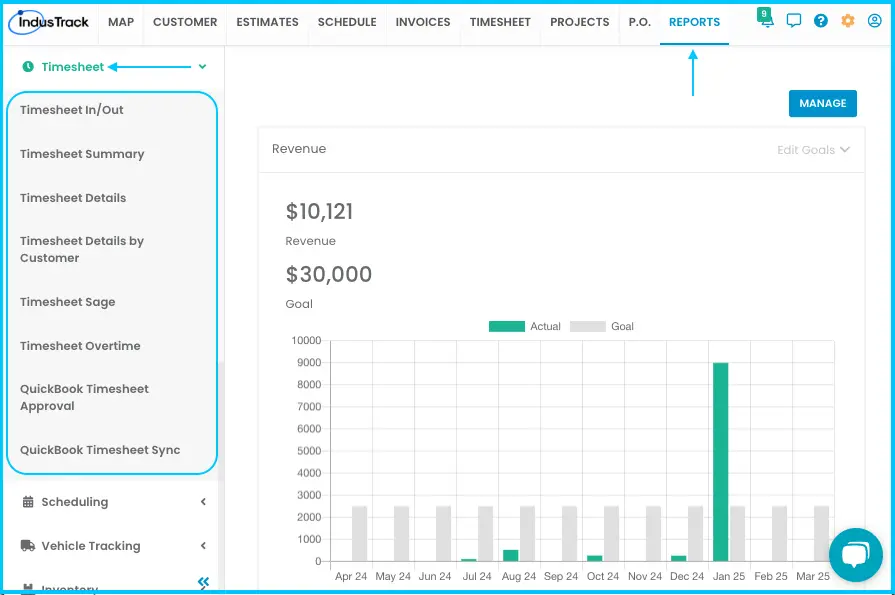
All hours are shown as decimals. Select the report under Reports›Timesheet, choose employees and a date range, and click Get Report.
| Report | What it shows | Columns |
|---|---|---|
| Timesheet In/Out | Clock-in and clock-out times | Empl ID, Empl Name, Empl Position, Vehicle ID, Vehicle Name, Day, Date, Time, Type (for example start travel, start break), Hours, Cost Code, Job #, Customer, Location, Notes |
| Timesheet Summary | Total hours and pay, from shift records only | Employee ID, Employee Name, Employee Position, Start Date, End Date, Total Hours, Total Pay (cost per hour × hours worked) |
| Timesheet Details | Detailed breakdown of hours | Employee ID, Name, Position, Date, Day, Start, End, Time Type, Job #, Customer, Shift Hrs, Job Hrs, Break Hrs, Travel Hrs, Cost Code, Pay Code, Rate, Shift Pay (rate × shift hours), Job Pay (rate × job hours) |
| Timesheet Details by Customer | The same details, organized by customer | Same as Timesheet Details |
| Timesheet Sage | Timesheet data for Sage payroll | Date, Employee ID, Name, Position, Scanned Number (Split), Scanned Number, Start Time, End Time, Start Break, End Break, Notes, Job Hours, Start Location, End Location |
| Timesheet Overtime | Overtime hours | Empl Name, Empl Position, Regular Hours, Weekly Overtime, Daily Overtime, Weekend Overtime |
| QuickBook Timesheet Approval | Timesheets approved for QuickBooks sync | Employee, Day, Date(s), In, Out, Total, Type, Customer, Location, Edited By |
| QuickBook Timesheet Sync | Timesheets synced to QuickBooks | Same as QuickBook Timesheet Approval |
| Timesheet Overall | How employees spend their time | Employee Name, Total Time Worked (total shift hours), Job Time, Travel Time, Unallocated Time (shift time not linked to a job or travel) |
In Timesheet In/Out and Timesheet Details, the Job # of a scheduled job is a link that opens the job. Jobs that employees added themselves on their timesheet show as plain text.
Users
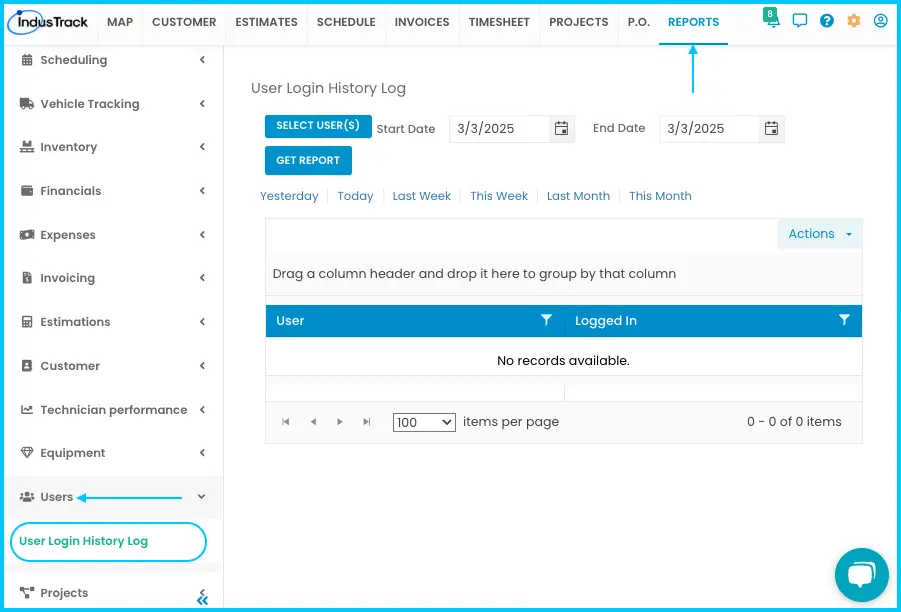
User Login History Log: when office users logged in.
-
Go to Reports›Users›User Login History Log.
-
Select a User.
-
Pick a start and end date, or a preset.
-
Click Get Report.
Watch: Running the User Login History Log
Columns: User and Logged In (date and time).
The date range can't be longer than 90 days; a longer range won't generate. For a longer period, run several reports in smaller ranges.
Common questions
Why doesn't a deactivated employee appear in the employee list?
Deactivated employees are hidden from the drop-down. If you select All Employees, a deactivated employee who has timesheet records in the date range is still included.
Why is a job missing from a timesheet or performance report?
Jobs that last less than a minute don't appear. If a job is completed but has no duration, check the Timesheet module for conflicts. Conflicts must be resolved before actual durations show in reports.
Why does the Timesheet report show negative shift hours?
Paid time is shift time minus unpaid break time, worked out per day. Only unpaid breaks are subtracted from shift hours; paid breaks aren't. Shifts and breaks are only compared when they have the same cost code, so an unpaid break with a cost code that has no matching shift counts as negative. For example, a 5.18-hour shift with a 1-hour unpaid break gives 4.18 paid hours.
Can I restore a deleted item from the Audit report?
Contact IndusTrack Support. They'll check whether it can be restored.
Why is an invoice missing from Invoice By Inventory Type?
This report only includes invoices converted from a job. Invoices with no job are left out, and the date filter is the job completion date.
Why can't I save my column settings?
At least one column must be checked. If you uncheck them all, Save is disabled and you see "At least one column must be selected."
Can I get reports by email automatically?
Yes, for reports that have Schedule Report in the Actions menu. See How do I schedule a report to email automatically?
Was this article helpful?
Contact support